Your Power App Runs Fine. Why Is Power Apps Studio Unusable?
Power Apps · Performance · Architecture
Your app runs fine. Why is Studio unusable?
A fast published app and a painfully slow editor are not contradictory. They are two different workloads—and they require two different investigations.
A canvas app opens quickly for users. Navigation is smooth. Data operations complete in acceptable time. Yet opening the same app in Power Apps Studio takes minutes, selecting a control pauses the editor, and entering a formula feels like typing through a remote desktop connection.
Teams often respond by optimizing runtime formulas. That may improve the player and leave the authoring experience untouched. The first useful question is not “Why is the app slow?” It is “Which app experience is slow?”
Do not use a runtime profiler to explain an authoring problem.
Runtime and Studio are different systems
The published player evaluates the formulas and controls required by a user's current session. Studio must additionally load the authoring model, build dependency information, validate formulas, maintain property panels, support undo, render the design surface, and react to every edit.
| Symptom | Likely workload | First evidence |
|---|---|---|
| Slow app startup for users | Runtime | Player timing, Monitor, App Insights |
| Slow gallery or button action | Runtime | Network calls and formula evaluation |
| Studio takes minutes to open | Authoring | App/version/control-count baseline |
| Selecting or copying controls freezes | Authoring graph and designer | Screen/control isolation test |
| Formula editor lags per keystroke | Authoring analysis | Minimal reproduction and authoring version |
| Save or publish is slow | Authoring/package processing | Package size, media and version comparison |
Turn “Studio is slow” into evidence
Record four timings before changing anything: open the app, select a control on a heavy screen, edit and commit a simple formula, and save the app. Capture the authoring version, browser, device memory, app size, number of screens, approximate control count, media size, and whether the same version is fast for another maker.
Then restore or copy an earlier app version into a development environment and repeat the timings. A sharp regression between two versions is more useful than a general statement that the app has “become large.”
Preserve the slow version.
Do not overwrite your best reproduction while experimenting. Microsoft support and your own future investigation need a stable before-and-after case.
Use feature toggles as diagnostics, not folklore
Community reports sometimes associate a Studio regression with an authoring feature such as the New Analysis Engine. A toggle comparison can help isolate a regression. It is not proof that the feature is the root cause, and permanently disabling analysis is not an architecture strategy. Record both results, the exact Studio version, and raise a reproducible support case.
The hidden cost is often the dependency graph
Large screen counts get attention because they are easy to count. Cross-screen control references, duplicated formulas, global state, and tightly coupled components are usually more important. A control on one screen that directly reads a control on another screen couples both authoring surfaces. Multiply that pattern across a large app and a local edit is no longer local.
- Replace cross-screen control references with explicit navigation parameters, variables, or a deliberate state model.
- Move stable calculations into named formulas instead of repeating them across controls.
- Do not duplicate whole screens to create variants; extract the shared behavior.
- Remove unused media, controls, variables, and abandoned screens.
- Keep reusable components focused; a component with dozens of loosely related inputs only moves the coupling elsewhere.
- Review deeply nested containers and galleries with many template controls.
Monitor tells you about runtime
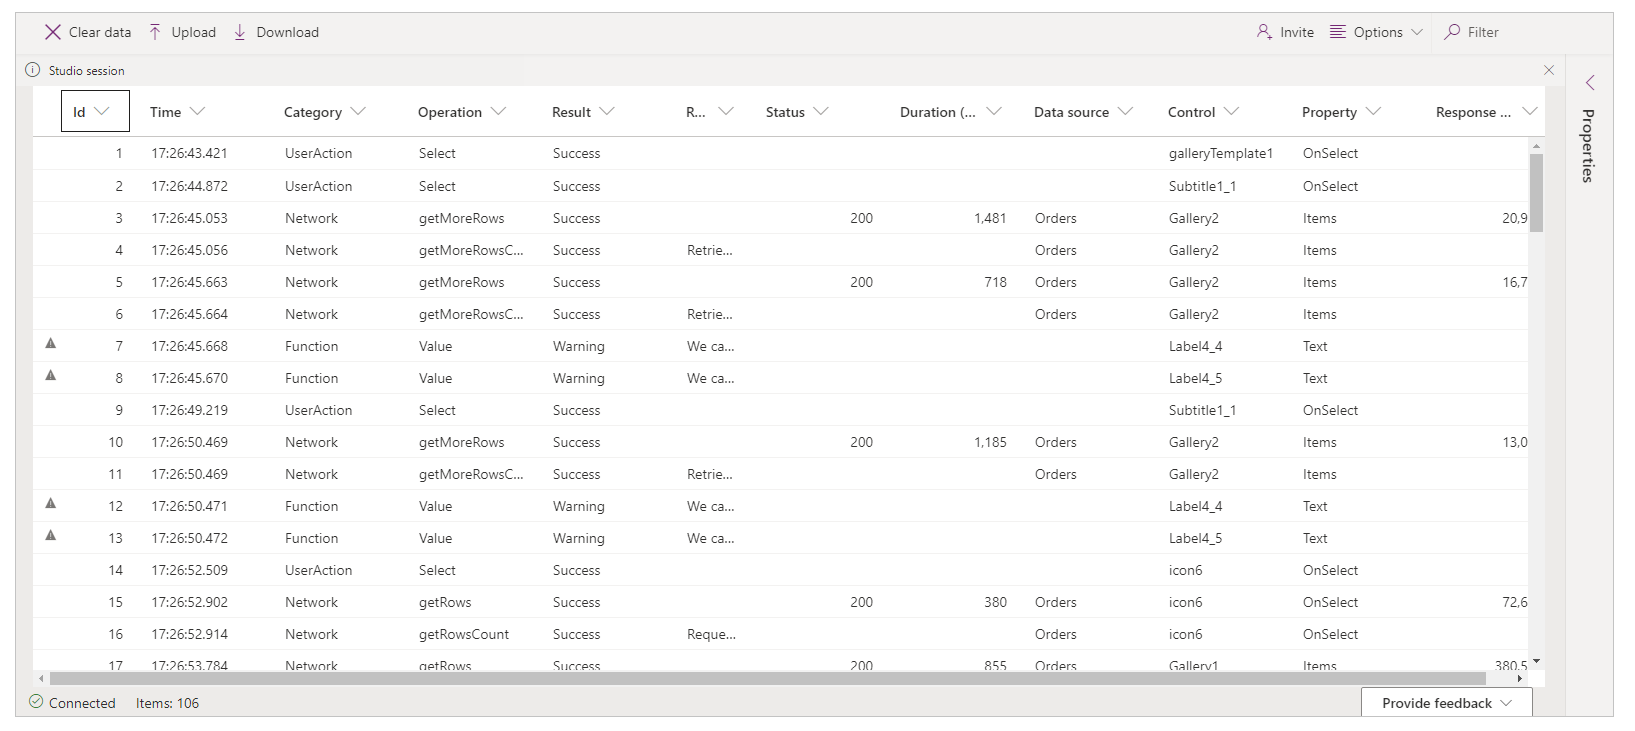
Live Monitor is excellent for tracing data calls, connector responses, formula behavior, and throttling while an app runs. It should be part of every runtime investigation. It does not measure how long Studio needs to select a control or update its authoring model.
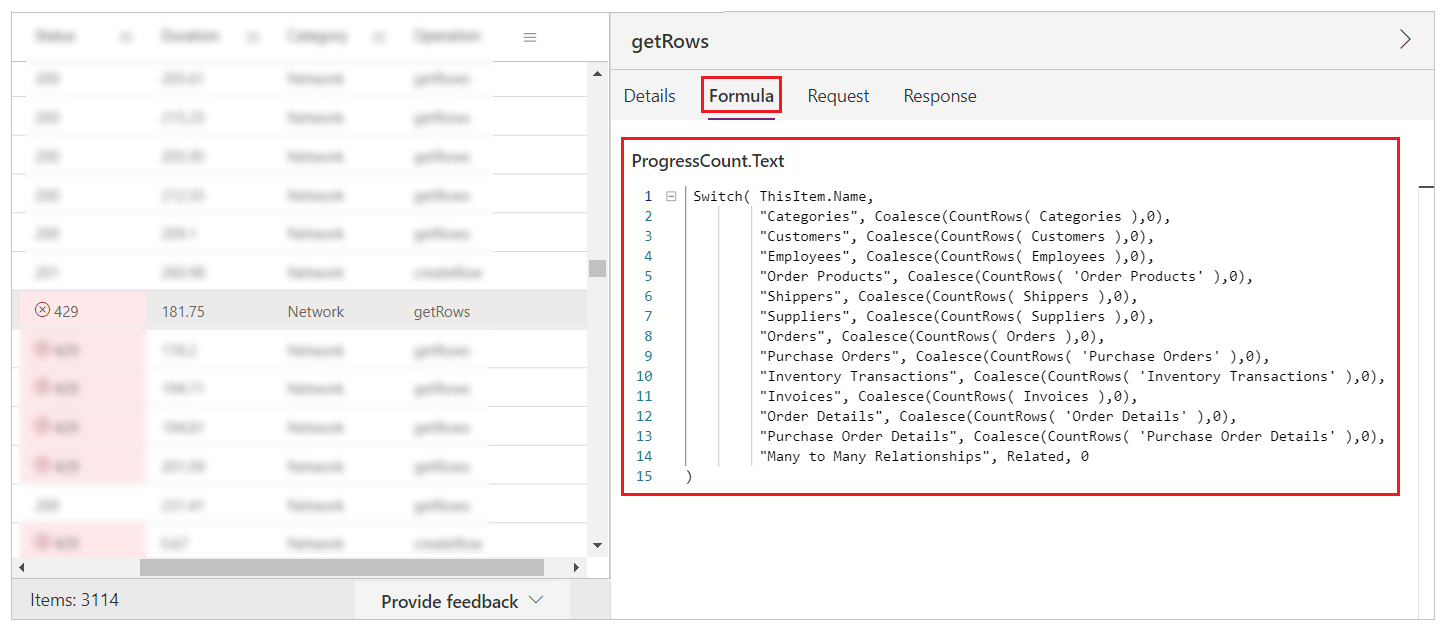
For example, Microsoft documents a case where a single create operation caused multiple additional getRows calls and eventually HTTP 429 throttling. That is a runtime dependency problem: a property was repeatedly evaluating nondelegable counts against several tables.
When one canvas app is too much app
A hundred screens are not automatically wrong, and “split every large app” is poor advice. Splitting introduces navigation, shared-state, deployment, security, and user-experience costs. The correct boundary is usually a business capability with its own users, lifecycle, data access, and release cadence.
Split when teams can deploy one capability without coordinating every change, when most users only need a subset, or when a failure in one module should not block the rest. Keep one app when the workflow is genuinely continuous and splitting would create fragile handoffs.
| Option | Use when | Watch for |
|---|---|---|
| Refactor in place | One coherent process, manageable ownership | Coupling merely hidden in components |
| Split into multiple apps | Distinct capabilities and audiences | Navigation and duplicated state |
| Move logic server-side | Rules must be shared or secured | Latency and operational ownership |
| Replace a module with a standard product | The capability is not differentiating | Customization recreating the old monolith |
A practical recovery playbook
- Classify the problem. Confirm whether runtime, authoring, or both are slow.
- Freeze a baseline. Record timings and preserve a reproducible app version.
- Compare versions. Find the smallest change window where latency jumped.
- Isolate by screen or module. Work on a copy and remove half of the suspected area at a time.
- Reduce dependencies. Prioritize cross-screen references, repeated formulas, global state, and copied controls.
- Measure runtime separately. Use App Checker, Monitor, and Application Insights for published behavior.
- Escalate with evidence. Include authoring version, timings, reproduction steps, and the smallest failing app.
- Set an architecture threshold. Do not wait for the next freeze before deciding when a capability deserves its own app.
A fast player does not excuse an editor that prevents the next safe change.


Comments
Post a Comment